top-kat and Streaming Algorithms in Bytewax
A tech dive from our intern, Isaac Milstein
Written by Oli Makhasoeva & Isaac Milstein
Online Machine Learning is a dynamic approach to ML, incrementally processing and learning from data, one piece at a time. Ideal for large datasets or streaming data, it adapts to changing environments, continually updating its model for optimal results, unlike traditional batch processing methods.
Yes, and you can do it in Python end-to-end! 🐍
Online machine learning system requires real-time stream processing. To manage streaming data, we use streaming systems that are made up of a storage and compute layer.
The storage layer provides consistency, replayability, and ordering and it should be performant. The processing layer provides the ability to consume the data and run compute operations on it (aggregations, transformations, etc.).
Core to the streaming processing layer is a category of data processing software called stream processors. There are many different processors available. The main differences are whether they are stateful or not and whether the interface is imperative (Python, Go etc.) or declarative (SQL, YAML, etc.).
Zander Matheson covers different streaming tools in his talk "Interactive dashboards to detect data anomalies in real time" on our YouTube channel. He goes into details we don't cover here so if you want to go deeper, please check it out! And subscribe to the Streaming Python channel for videos like this! 💛
You can find all the code in this repository. Give it a star ⭐ on GitHub if you like it.
We will build a system that leverages Online ML to detect anomalies in streaming data coming from temperature sensors. In our example, we can imagine our temperature sensors are in a warehouse or manufacturing facility, and we want to know as soon as possible if the temperature has changed so we can investigate what is happening.
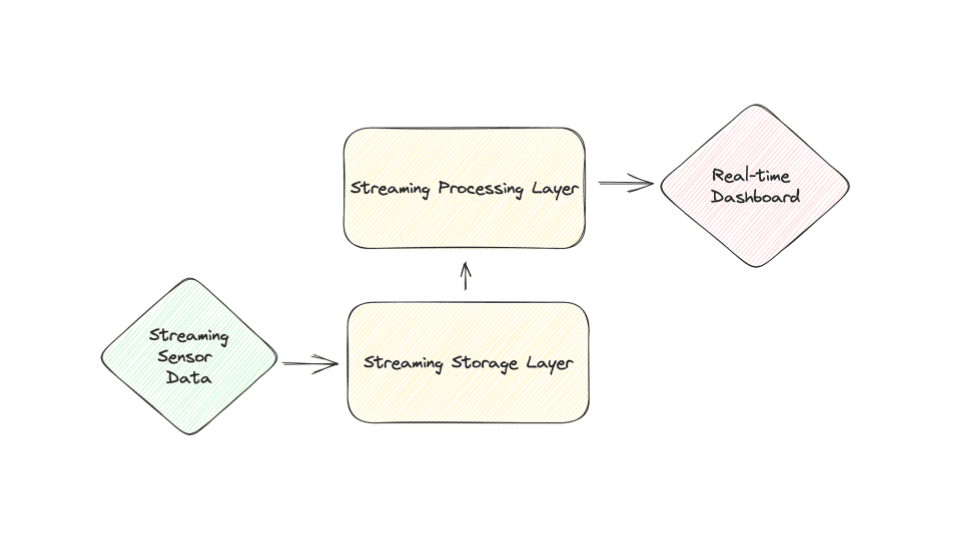
To do this, we will generate sensor data and send it to our streaming storage layer. We will then consume that in our stream processor to do anomaly detection. Finally, we will plot our data on a dashboard to view our system running in real-time.
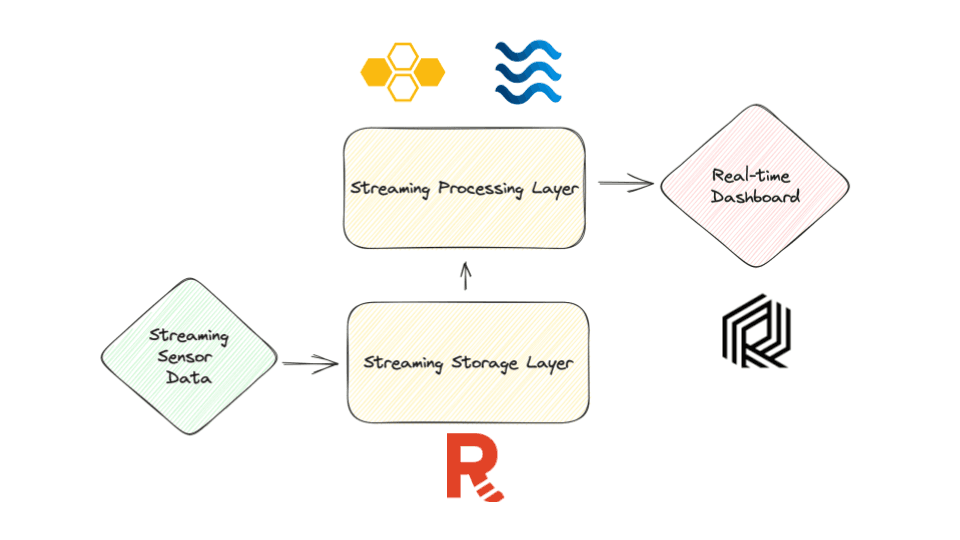
For our streaming storage layer, we will set up Redpanda. Redpanda is a Kafka API-compatible streaming platform.
For the stream processing layer, we will use Bytewax as the stream processor, and River is a Python library for Online ML.
For Visualization, we will use Rerun. It is a visualization library with a Python interface and Rust processing engine.
Bytewax is fundamentally built around the principle of dataflow. The dataflow represents a graph that manages the stream processing pipeline. Dataflows can be parallelized across the IO for increased throughput and can be run on processes or threads depending on the compute requirements.
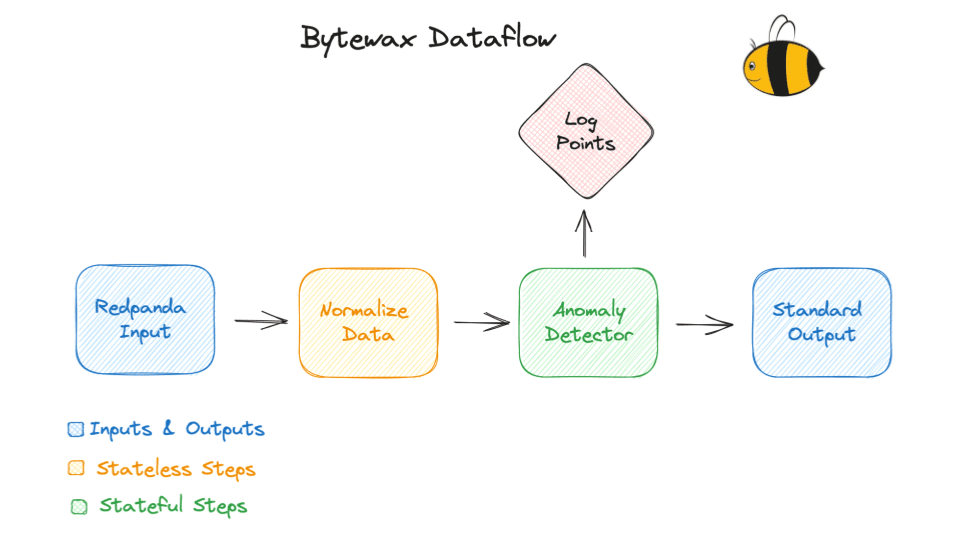
Dataflows consist of multiple steps: inputs, stateful and stateless operations, and outputs.
The following snippet demonstrates the creation of the dataflow, inputs, and deserialization.
flow = Dataflow()
flow.input("input", KafkaInput(["localhost:19092"], ["sensors"]))
# ("sensor_id", "{"ts":"2023..."}")

def deserialize(key_bytes__payload_bytes):
    key_bytes, payload_bytes = key_bytes__payload_bytes
    sensor_id = str(json.loads(key_bytes.decode())) if key_bytes else None
    data = json.loads(payload_bytes.decode()) if payload_bytes else None
    return sensor_id, data

flow.map(deserialize)
We need to normalize our data for the anomaly detection algorithm. Since we know the min and max in our contrived example, we can scale using the min_max_scalar.
def min_max_scalar(sensor_id__data: tuple, min: float, max: float):
    """
    Our anomaly detector requires normalized data between 0 and 1.
    This function will scale our data between the min and max.

    min (float) - lowest value in the dataset
    max (float) - max value in the dataset
    """
    sensor_id, data = sensor_id__data
    data['temp_normalized'] = (data['temp']-min)/(max-min)
    return (sensor_id, data)

flow.map(lambda x: min_max_scalar(x, 21.0, 85.0))
class AnomalyDetector(anomaly.HalfSpaceTrees):
     def __init__(self, *args, **kwargs):
        super().__init__(*args, n_trees=5, height=3, window_size=30, seed=42, **kwargs)

    def update(self, data):
        print(data)
        dt = datetime.strptime(data["ts"], '%Y-%m-%d %H:%M:%S')
        t = int(dt.timestamp())
        data["score"] = self.score_one({"value": data["temp_normalized"]})
        self.learn_one({"value": data["temp_normalized"]})
        rr.log_scalar(f"temp_{data['sensor_id']}/data", data["temp"], color=[155, 155, 155])
        if data["score"] > 0.7:
            data["anom"] = True
            rr.log_point(f"3dpoint/anomaly/{data['sensor_id']}", [t, data["temp"], float(data['sensor_id'])], radius=0.3, color=[255,100,100])
            rr.log_scalar(
                f"temp_{data['sensor_id']}/data/anomaly",
                data["temp"],
                scattered=True,
                radius=3.0,
                color=[255, 100, 100],
            )
        else:
            data["anom"] = False
            rr.log_point(f"3dpoint/data/{data['sensor_id']}", [t, data["temp"], float(data['sensor_id'])], radius=0.1)
        return self, data


flow.stateful_map("detector", lambda: AnomalyDetector(), AnomalyDetector.update)
The AnomalyDetector is a class derived from the HalfSpaceTrees object from the River package. This object uses the Half Space Trees anomaly detection algorithm which is particularly useful for identifying outliers or anomalies in streaming data.
Along the way, our AnomalyDetector object will log the temperature to Rerun. When the calculated score of the data point is above 0.7, it considers this data point to be an anomaly and will log additional information and tags for such data points.
Check out this repository to learn how to build a real-time anomaly detection application with Bytewax that
docker-compose for your convenience)You will also build a dashboard using Rerun to visualize the anomalies in real time.