This blog post breaks down a pattern of using Arrow to facilitate efficient and simple streaming workloads by compressing micro-batches of arrow tables. Credit to Chris Comeau who originally inspired this post with his work on using Arrow for streaming workloads.
We will introduce Arrow, the IPC serialization format, Kafka, and Bytewax and explain why these tools should be used together as a complete streaming architecture.
Skip the words and check out the code - https://github.com/bytewax/streaming-arrow
Background
Before we get started, let's start with a bit of background around why we might use this approach.
One problem that arises as you adopt streaming data in an organization is the problem that some portion of the data is coming in batches and the other half of it is in streams. This may be the result of building in some event-driven features in your application, but managing a traditional batch ETL process for everything else.
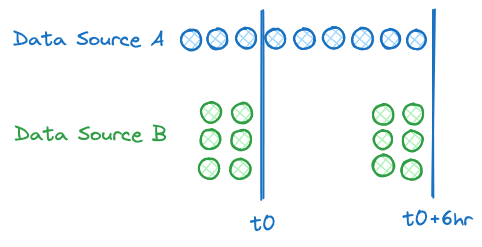
In this case, you end up suffering from the slowest common denominator problem for all of your analytical processing. The slowest common denominator problem states that you are limited by the slowest available data and therefore you can only provide intelligence at the speed or freshness of your slowest available data. For example, in the diagram below, despite continuously generating data for source A, we can only provide intelligence that uses both sources at the interval we receive data from source B.
Today, most new and exciting features are powered by data, whether through machine intelligence like AI, or as an interactive analytical product. Some examples are ordering a ride on Uber or Lyft, looking at content on TikTok or checking out while purchasing on amazon.com. All of these experiences are powered by data. More specifically, real-time, continuously generated data. When you think of the leading companies/products in many industries today, the speed and freshness of data in these products are key determinants of their success. A key part of that is that the data is used in an algorithm or model to create a better experience or drive more engagement.
We mentioned event-drive and analytical processing, what do these patterns mean in a streaming data context?
Patterns in Streaming Data
There are largely two different patterns that have different requirements when it comes to streaming data.
Event-driven patterns
For event-driven patterns, you care more about the single event than the sum of the events. For example, when a user triggers an email with an event on your web application. Or banking transactions.
Event-driven patterns were the initial driver for the adoption of streaming systems. Businesses could have a shared substrate and protocol to interact with to process events as they occurr.
Analytical patterns
For analytical patterns you care about the sum of the events more than a single event. Only the sum of the events will give you enough information to make a decision. This is the evolution of processing as we have more sophisticated approaches to model what we as humans do with streams of information.
As a trivial example of why a stream of information is important, think about the location of a vehicle, a single point provides us with very little information, but a stream of points will give us information about speed, heading etc.
Analytical Architectural Patterns
An architectural pattern that I've seen Bytewax used for is capturing many disparate input sources, joining the data, normalizing the structure and pre-aggregating the data in a single pipeline. The resulting data is produced to a broker and then can be consumed by many services downstream of the broker. These workloads are generally analytical patterns, and the user cares about both the aggregate of the events and the timeliness. As an example, let's say I have many sensors distributed across a supply chain, I might not be able to reason about what is happening from an individual sensor reading, but the sensors in aggregate and over time tell me if the supply chain is functioning correctly. I also don't need to react to every sensor reading immediately, but I need to passively understand what is going on so I can react immediately for safety or monetary reasons.
A streaming arrow solution
The proposed solution to the above problem is great (in my opinion 😄) in that it can actually solve two problems at once! First, we will have our data available aggregated and in a format that can be directly used for analytical purposes, whether that be making a prediction or just engineering features for a model. Second, we have made our ingestion task much easier as we will find out further on in the article! Below you can see a diagram of the proposed solution.

Let's get streaming!
For this example we are going to borrow from the Bytewax community user who inspired this post. First, we will use Bytewax to "gather" events from disparate sensor sources and transform them into micro-batches that will be an Arrow table. We will then write these Arrow tables to a message broker like Redpanda to provide us with some durability, replayability, and any fan-out workloads downstream. Then downstream we can use Bytewax to run real-time alerting or analysis we need and also create another workload that will load our data to a sink like Clickhouse for additional reporting/querying.
What's great is that you could sub in literally any Kafka API-compatible streaming platform and substitute any Sink that is arrow-compatible downstream.
I don't have a ton of sensors at my disposal, so we can use our own computer statistics 😁
import pyarrow as pa
from bytewax.connectors.kafka import KafkaSinkMessage, operators as kop
import bytewax.operators as op
from bytewax.dataflow import Dataflow
from bytewax.testing import TestingSource
from datetime import datetime
from time import perf_counter
import psutil


BROKERS = ["localhost:19092"]
TOPIC = "arrow_tables"

run_start = perf_counter()

SCHEMA = pa.schema([
    ('device',pa.string()),
    ('ts',pa.timestamp('us')), # microsecond
    ('cpu_used',pa.float32()),
    ('cpu_free',pa.float32()),
    ('memory_used',pa.float32()),
    ('memory_free',pa.float32()),
    ('run_elapsed_ms',pa.int32()),
])

def sample_wide_event():
    return {
        'device':'localhost',
        'ts': datetime.now(),
        'cpu_used': psutil.cpu_percent(),
        'cpu_free': round(1 - (psutil.cpu_percent()/100),2)*100,
        'memory_used': psutil.virtual_memory()[2],
        'memory_free': round(1 - (psutil.virtual_memory()[2]/100),2)*100,
        'run_elapsed_ms': int((perf_counter() - run_start)*1000)
    }

def sample_batch_wide_table(n):
    samples = [sample_wide_event() for i in range(n)]
    arrays = []
    for f in SCHEMA:
        array = pa.array([samples[i][f.name] for i in range(n)], f.type)
        arrays.append(array)
    t = pa.Table.from_arrays(arrays, schema=SCHEMA)

    return t

def table_to_compressed_buffer(t: pa.Table) -> pa.Buffer:
    sink = pa.BufferOutputStream()
    with pa.ipc.new_file(
        sink,
        t.schema,
        options=pa.ipc.IpcWriteOptions(
            compression=pa.Codec(compression="zstd", compression_level=1)
        ),
    ) as writer:
        writer.write_table(t)
    return sink.getvalue()

BATCH_SIZE = 1000
N_BATCHES = 10
table_gen = (sample_batch_wide_table(BATCH_SIZE) for i in range(N_BATCHES))

flow = Dataflow("arrow_producer")

# this is only an example. should use window or collect downstream
tables = op.input("tables", flow, TestingSource(table_gen))

buffers = op.map("string_output", tables, table_to_compressed_buffer)
messages = op.map("map", buffers, lambda x: KafkaSinkMessage(key=None, value=x))
op.inspect("message_stat_strings", messages)
kop.output("kafka_out", messages, brokers=BROKERS, topic=TOPIC)
In this dataflow we capture continuously generated data from the machine it is running on. We then take the data and format it into a pyarrow table format with specific types. We serialize this using the arrow IPC binary format and write it to Kafka.
The benefits of using PyArrow are that there are some efficiencies we are going to gain downstream by limiting the requirement of copying data and less efficient serialization processes. The other benefit is the vast number of Python data libraries and data stores that use Arrow as the data format, which increases the flexibility of our capabilities downstream.
Once we have Arrow tables in Kafka, we can have multiple downstream consumers who can use the data.
As an example, we could run an analysis pipeline that uses polars like the one shown below.
from bytewax import operators as op
from bytewax.connectors.kafka import operators as kop
from bytewax.dataflow import Dataflow
import pyarrow as pa
import polars as pl

BROKERS = ["localhost:19092"]
TOPICS = ["arrow_tables"]

flow = Dataflow("kafka_in_out")
kinp = kop.input("inp", flow, brokers=BROKERS, topics=TOPICS)
op.inspect("inspect-errors", kinp.errs)
tables = op.map("tables", kinp.oks, lambda msg: pl.from_arrow(pa.ipc.open_file(msg.value).read_all()))

# get the max value
max_cpu = op.map("tables", kinp.oks, lambda df: df.select(pl.col("cpu_used").max()))
op.inspect("max_cpu", max_cpu)
And we could also write the data to ClickHouse at the same time.
from typing import Any, List
from typing_extensions import override
import logging

from bytewax.outputs import StatelessSinkPartition, DynamicSink
from pyarrow import concat_tables, Table
from clickhouse_connect import get_client

# Configure logging
logging.basicConfig(level=logging.INFO)
logger = logging.getLogger(__name__)

class _ClickHousePartition(StatelessSinkPartition):
    def __init__(self, table_name, host, port, username, password, database):
        self.table_name = table_name
        self.host = host
        self.port = port
        self.username = username
        self.password = password
        self.database = database
        self.client = get_client(host=self.host, port=self.port, username=self.username, password=self.password, database=self.database)

    @override
    def write_batch(self, batch: List[Table]) -> None:
        arrow_table = concat_tables(batch)
        self.client.insert_arrow(f"{self.database}.{self.table_name}", arrow_table)


class ClickhouseSink(DynamicSink):
    def __init__(self, table_name, username, password, host="localhost", port=8123, database=None, schema=None, order_by=''):
        self.table_name = table_name
        self.host = host
        self.port = port
        self.username = username
        self.password = password
        self.database = database
        self.schema = schema

        # init client
        if not self.database:
            logger.warning("database not set, using 'default'")
            self.database = 'default'
        client = get_client(host=self.host, port=self.port, username=self.username, password=self.password, database=self.database)

        # Check if the table exists
        table_exists_query = f"EXISTS {self.database}.{self.table_name}"
        table_exists = client.command(table_exists_query)
        if not table_exists:
            logger.info(f"""Table '{self.table_name}' does not exist.
                        Attempting to create with provided schema""")
            if schema:
                # Create the table with ReplacingMergeTree
                create_table_query = f"""
                CREATE TABLE {database}.{table_name} (
                    {self.schema}
                ) ENGINE = ReplacingMergeTree()
                ORDER BY tuple({order_by});
                """
                client.command(create_table_query)
                logger.info(f"Table '{table_name}' created successfully.")
            else:
                raise("""Can't complete execution without schema of format
                        column1 UInt32,
                        column2 String,
                        column3 Date""")
        else:
            logger.info(f"Table '{self.table_name}' exists.")

            # Check the MergeTree type
            mergetree_type_query = f"SELECT engine FROM system.tables WHERE database = '{self.database}' AND name = '{self.table_name}'"
            mergetree_type = client.command(mergetree_type_query)
            logger.info(f"MergeTree type of the table '{table_name}': {mergetree_type}")

            if "ReplacingMergeTree" not in mergetree_type:
                logger.warning(f"""Table '{table_name}' is not using ReplacingMergeTree.
                               Consider modifying the table to avoid performance degredation
                               and/or duplicates on restart""")

            # Get the table schema
            schema_query = f"""
            SELECT name, type FROM system.columns
            WHERE database = '{self.database}' AND table = '{self.table_name}'
            """
            schema_result = client.query(schema_query)
            columns = schema_result.result_rows
            logger.info(f"Schema of the table '{self.table_name}':")
            for column in columns:
                logger.info(f"Column: {column[0]}, Type: {column[1]}")

        client.close()

    @override
    def build(
        self, _step_id: str, _worker_index: int, _worker_count: int
    ) -> _ClickHousePartition:
        return _ClickHousePartition(self.table_name, self.host, self.port, self.username, self.password, self.database)
We now have the ability to run operational workloads and real-time analytics relatively easily, and we have greatly reduced the burden of serializing data, managing multiple data formats, and using different native tools to build a complete real-time data stack.
Check out the repository to see the entire code and how to run the infrastructure yourself.
💛 Bytewax! Give us a star on GitHub.
Real-time content update detection in production with Bytewax

