Rerun's open sourcing in February marked a significant step for those looking for accessible yet potent Python visualization libraries. Why is visualization important? Visualization is essential since companies like Scale.ai, Weights & Biases, and Hugging Face have streamlined deep learning by addressing dataset labeling, experiment tracking, and pre-trained models. However, a void still exists in rapid data capture and visualization.
Many companies develop in-house data visualization solutions but often end up with suboptimal tools due to high development costs. Moreover, Python visualization on streaming data is a problem that is not solved well either, leading to JavaScript based solutions in notebooks. Rerun leverages a Python interface into a high-performant Rust visualization engine (much like Bytewax!) that makes it dead easy to analyze streaming data.
In this blog post, we will explore how to use Bytewax and Rerun to visualize real-time streaming data in Python and create a real-time anomaly detection visualization. We chose anomaly detection, a.k.a. outlier detection, because it is a critical component in numerous applications, such as cybersecurity, fraud detection, and monitoring of industrial processes. Visualizing these anomalies in real time can aid in quickly identifying potential issues and taking necessary actions to mitigate them.
For those eager to dive in, check out our end-to-end Python solution on our GitHub. Don't forget to star Bytewax!
Overview
Here is what we'll cover:
- We will navigate the code and briefly discuss top-level entities
- Then we will discuss each step of the dataflow in greater detail: initialization of our dataflow, input source, stateful anomaly detection, data visualization & output, and how to spawn a cluster
- Finally, we will learn how to run it and see the beautiful visualization, all in Python <3
- As a bonus, we will think about other use cases
Let's go!
Setup your environment
This blog post is based on the following versions of Bytewax and Rerun:
bytewax==0.15.1
rerun-sdk==0.4.0
Rerun and Bytewax are installable as
pip install rerun-sdk
pip install bytewax
Follow Bytewax for updates as we are baking a new version that will ease the development of data streaming apps in Python further.
Code
The solution is relatively compact, so we copy the entire code example here. Please feel free to skip this big chunk if it looks overwhelming; we will discuss each function later.
import random
# pip install rerun-sdk
import rerun as rr

from time import sleep
from datetime import datetime

from bytewax.dataflow import Dataflow
from bytewax.execution import spawn_cluster
from bytewax.inputs import ManualInputConfig, distribute
from bytewax.outputs import ManualOutputConfig


rr.init("metrics")
rr.spawn()

start = datetime.now()

def generate_random_metrics(worker_index, worker_count, resume_state):
    assert resume_state is None
    keys = ["1", "2", "3", "4", "5", "6"]
    this_workers_keys = distribute(keys, worker_index, worker_count)

    for _ in range(1000):
        for key in this_workers_keys:
            value = random.randrange(0, 10)
            if random.random() > 0.9:
                value *= 2.0
            yield None, (key, (key, value, (datetime.now() - start).total_seconds()))
            sleep(random.random() / 10.0)


class ZTestDetector:
    """Anomaly detector.

    Use with a call to flow.stateful_map().

    Looks at how many standard deviations the current item is away
    from the mean (Z-score) of the last 10 items. Mark as anomalous if
    over the threshold specified.
    """

    def __init__(self, threshold_z):
        self.threshold_z = threshold_z

        self.last_10 = []
        self.mu = None
        self.sigma = None

    def _push(self, value):
        self.last_10.insert(0, value)
        del self.last_10[10:]

    def _recalc_stats(self):
        last_len = len(self.last_10)
        self.mu = sum(self.last_10) / last_len
        sigma_sq = sum((value - self.mu) ** 2 for value in self.last_10) / last_len
        self.sigma = sigma_sq**0.5

    def push(self, key__value__t):
        key, value, t = key__value__t
        is_anomalous = False
        if self.mu and self.sigma:
            is_anomalous = abs(value - self.mu) / self.sigma > self.threshold_z

        self._push(value)
        self._recalc_stats()
        rr.log_scalar(f"temp_{key}/data", value, color=[155, 155, 155])
        if is_anomalous:
            rr.log_point(f"3dpoint/anomaly/{key}", [t, value, float(key) * 10], radius=0.3, color=[255,100,100])
            rr.log_scalar(
                f"temp_{key}/data/anomaly",
                value,
                scattered=True,
                radius=3.0,
                color=[255, 100, 100],
            )
        else:
            rr.log_point(f"3dpoint/data/{key}", [t, value, float(key) * 10], radius=0.1)

        return self, (value, self.mu, self.sigma, is_anomalous)


def output_builder(worker_index, worker_count):
    def inspector(input):
        metric, (value, mu, sigma, is_anomalous) = input
        print(
            f"{metric}: "
            f"value = {value}, "
            f"mu = {mu:.2f}, "
            f"sigma = {sigma:.2f}, "
            f"{is_anomalous}"
        )

    return inspector


if __name__ == '__main__':
    flow = Dataflow()
    flow.input("input", ManualInputConfig(generate_random_metrics))
    # ("metric", value)
    flow.stateful_map("AnomalyDetector", lambda: ZTestDetector(2.0), ZTestDetector.push)
    # ("metric", (value, mu, sigma, is_anomalous))
    flow.capture(ManualOutputConfig(output_builder))
    spawn_cluster(flow)
The provided code demonstrates how to create a real-time anomaly detection pipeline using Bytewax and Rerun. Let's break down the essential components of this code:
- generate_random_metrics: This function generates random metrics simulating real-world data streams. It generates data points with a small chance of having an anomaly (values doubled).
- ZTestDetector: This class implements an anomaly detector using the Z-score method. It maintains the mean and standard deviation of the last 10 values and marks a value as anomalous if its Z-score is greater than a specified threshold.
- output_builder: This function is used to define the output behavior for the data pipeline. In this case, it prints the metric name, value, mean, standard deviation, and whether the value is anomalous.
- Dataflow: The main part of the code constructs the dataflow using Bytewax, connecting the RandomMetricInput, ZTestDetector, and the output builder.
- Rerun visualization: The Rerun visualization is integrated into the ZTestDetector class. The rr.log_scalar and rr.log_point functions are used to plot the data points and their corresponding anomaly status.
Now, with an understanding of the code's main components, let's discuss how the visualization is created step by step.
Building the Dataflow
To create a dataflow pipeline, you need to:
- Initialize a new dataflow with
flow = Dataflow(). - Define the input source using
flow.input("input", ManualInputConfig(generate_random_metrics)). - Apply the stateful anomaly detector using
flow.stateful_map("AnomalyDetector", lambda: ZTestDetector(2.0), ZTestDetector.push). - Configure the output behavior with
flow.capture(ManualOutputConfig(output_builder)). - Finally, spawn a cluster to execute the dataflow with
spawn_cluster(flow, proc_count=3).
The resulting dataflow reads the randomly generated metric values from input_builder, passes them through the ZTestDetector for anomaly detection, and outputs the results using the output_builder function.
Let's clarify the details for each step.
generate_random_metrics function
The generate_random_metrics function serves as an alternative input source for the dataflow pipeline, generating random metric values in a distributed manner across multiple workers. It accepts three parameters: worker_index, worker_count, and resume_state.
def generate_random_metrics(worker_index, worker_count, resume_state):
    assert resume_state is None
    keys = ["1", "2", "3", "4", "5", "6"]
    this_workers_keys = distribute(keys, worker_index, worker_count)

    for _ in range(1000):
        for key in keys:
            value = random.randrange(0, 10)
            if random.random() > 0.9:
                value *= 2.0
            yield None, (key, (key, value, (datetime.now() - start).total_seconds()))
            sleep(random.random() / 10.0)
worker_index: The index of the current worker in the dataflow pipeline.worker_count: The total number of workers in the dataflow pipeline.resume_state: The state of the input source from which to resume. In this case, it is asserted to beNone, indicating that the input source does not support resuming from a previous state.
Here's a step-by-step description of the generate_random_metrics function:
- Assert that
resume_stateisNone. - Define a list of keys representing the metrics.
- Distribute the keys among the workers using the distribute function (not provided in the code snippet). The distributed keys for the current worker are assigned to this_workers_keys.
- Iterate 1,000 times and, for each iteration, iterate through the list of keys:
- Generate a random value between 0 and 10.
- With a 10% probability, double the value to simulate an anomaly.
- Yield a tuple containing None (to indicate no specific partition key), the key, the generated value, and the elapsed time since the starting time (not provided in the code snippet).
- Introduce a sleep time between each generated value to simulate real-time data generation.
The generate_random_metrics function is used in the dataflow as the input source with the following line of code:
flow.input("input", ManualInputConfig(generate_random_metrics))
This line tells the dataflow to use the RandomMetricInput class to generate the input data for the pipeline.
ZTestDetector Class
The ZTestDetector class is an anomaly detector that uses the Z-score method to identify whether a data point is anomalous or not. The Z-score is the number of standard deviations a data point is from the mean of a dataset. If a data point's Z-score is higher than a specified threshold, it is considered anomalous.
The class has the following methods:
__init__(self, threshold_z): The constructor initializes the ZTestDetector with a threshold Z-score value. It also initializes the last 10 values list (self.last_10), mean (self.mu), and standard deviation (self.sigma)._push(self, value): This private method is used to update the list of last 10 values with the new value. It inserts the new value at the beginning of the list and removes the oldest value, maintaining the list length at 10._recalc_stats(self): This private method recalculates the mean and standard deviation based on the current values in the self.last_10 list.push(self, key__value__t): This public method takes a tuple containing a key, a value, and a timestamp as input. It calculates the Z-score for the value, updates the last 10 values list, and recalculates the mean and standard deviation. It also logs the data point and its anomaly status using Rerun's visualization functions. Finally, it returns the updated instance of the ZTestDetector class and a tuple containing the value, mean, standard deviation, and anomaly status.
The ZTestDetector class is used in the dataflow pipeline as a stateful map with the following code:
flow.stateful_map("AnomalyDetector", lambda: ZTestDetector(2.0), ZTestDetector.push)
This line tells the dataflow to apply the ZTestDetector with a Z-score threshold of 2.0 and use the push method to process the data points.
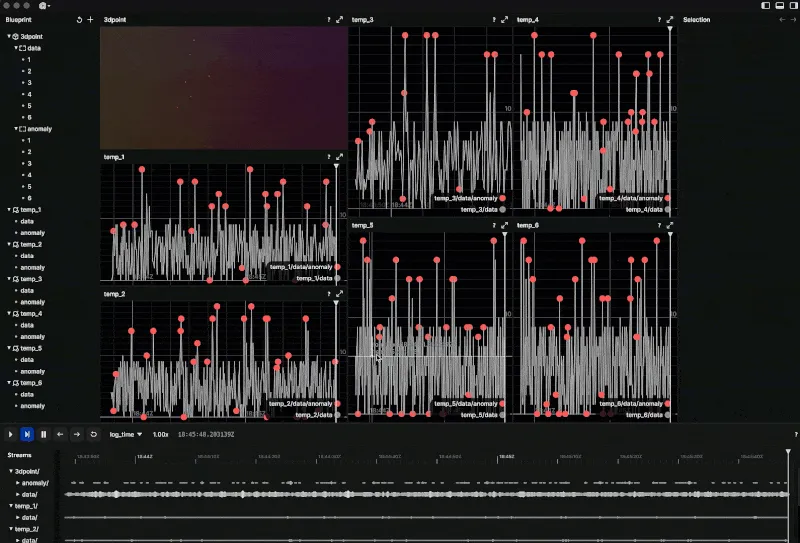
Visualizing Anomalies
To visualize the anomalies, the ZTestDetector class logs the data points and their corresponding anomaly status using Rerun's visualization functions. Specifically, rr.log_scalar is used to plot a scalar value, while rr.log_point is used to plot 3D points.
The following code snippet shows how the visualization is created:
rr.log_scalar(f"temp_{key}/data", value, color=[155, 155, 155])
if is_anomalous:
    rr.log_point(f"3dpoint/anomaly/{key}", [t, value, float(key) * 10], radius=0.3, color=[255,100,100])
    rr.log_scalar(
        f"temp_{key}/data/anomaly",
        value,
        scattered=True,
        radius=3.0,
        color=[255, 100, 100],
    )
else:
    rr.log_point(f"3dpoint/data/{key}", [t, value, float(key) * 10], radius=0.1)
Here, we first log a scalar value representing the metric. Then, depending on whether the value is anomalous, we log a 3D point with a different radius and color. Anomalous points are logged in red with a larger radius, while non-anomalous points are logged with a smaller radius.
output_builder Function
The output_builder function is used to define the output behavior for the data pipeline. In this specific example, it is responsible for printing the metric name, value, mean, standard deviation, and whether the value is anomalous. The function takes two arguments: worker_index and worker_count. These arguments help the function understand the index of the worker and the total number of workers in the dataflow pipeline.
Here's the definition of the output_builder function:
def output_builder(worker_index, worker_count):
    def inspector(input):
        metric, (value, mu, sigma, is_anomalous) = input
        print(
            f"{metric}: "
            f"value = {value}, "
            f"mu = {mu:.2f}, "
            f"sigma = {sigma:.2f}, "
            f"{is_anomalous}"
        )

    return inspector
This function is a higher-order function, which means it returns another function called inspector. The inspector function is responsible for processing the input data tuple and printing the desired output. The output builder function is later used in the dataflow pipeline when configuring the output behavior with
flow.capture(ManualOutputConfig(output_builder)).
Running the Dataflow
Bytewax can run as a single process or in a multi-process way. This dataflow has been created to scale across multiple processes, but we will start off running it as a single process with the spawn_cluster execution module.
spawn_cluster(flow)
If we wanted to increase the parallelism, we would simply add more processes as arguments. For example - spawn_cluster(flow, proc_count=3).
To run the provided code we can simply run it as a Python script, but first we need to install the dependencies.
Create a new file in the same directory as dataflow.py and name it requirements.txt. Add the following content to the requirements.txt file:
bytewax==0.15.1
rerun-sdk==0.4.0
Open a terminal in the directory containing the requirements.txt and dataflow.py files.
Install the dependencies using the following command:
pip install -r requirements.txt
And run the dataflow!
python dataflow.py
Expanding the Use Case
While the provided code serves as a basic example of real-time anomaly detection, you can expand this pipeline to accommodate more complex scenarios. For example:
- Incorporate real-world data sources: Replace the RandomMetricInput class with a custom class that reads data from a real-world source, such as IoT sensors, log files, or streaming APIs.
- Implement more sophisticated anomaly detection techniques: You can replace the ZTestDetector class with other stateful anomaly detection methods, such as moving average, exponential smoothing, or machine learning-based approaches.
- Customize the Visualization: Enhance the Rerun visualization by adding more data dimensions, adjusting the color schemes, or modifying the plot styles to better suit your needs.
- Integrate with alerting and monitoring systems: Instead of simply printing the anomaly results, you can integrate the pipeline with alerting or monitoring systems to notify the appropriate stakeholders when an anomaly is detected.
By customizing and extending the dataflow pipeline, you can create a powerful real-time anomaly detection and visualization solution tailored to your specific use case. The combination of Bytewax and Rerun offers a versatile and scalable foundation for building real-time data processing and visualization systems.
Conclusion
This blog post has demonstrated how to use Bytewax and Rerun to create a real-time anomaly detection visualization. By building a dataflow pipeline with Bytewax and integrating Rerun's powerful visualization capabilities, we can monitor and identify anomalies in our data as they occur.
New inputs/outputs, new windowing, and recent improvements in Bytewax v 0.16.0

Zander Matheson
CEO, FounderZander is a seasoned data engineer who has founded and currently helms Bytewax. Zander has worked in the data space since 2014 at Heroku, GitHub, and an NLP startup. Before that, he attended business school at the UT Austin and HEC Paris in Europe.